
Go beyond dashboards—build a smarter factory with actionable intelligence
Modern manufacturing isn’t just about machines, materials, and manpower—it’s about data. Every sensor reading, machine status, quality check, and operator input has the potential to improve performance. But most factories still struggle to translate that raw data into real-world impact.
This is where manufacturing data analytics tools come in. The best ones don’t just show you what happened—they help you understand why it happened and what to do next. And while many tools claim to offer “analytics,” very few are designed with the complexity, variability, and urgency of factory operations in mind.
Here are the nine essential features that separate real manufacturing intelligence platforms from static reporting dashboards.
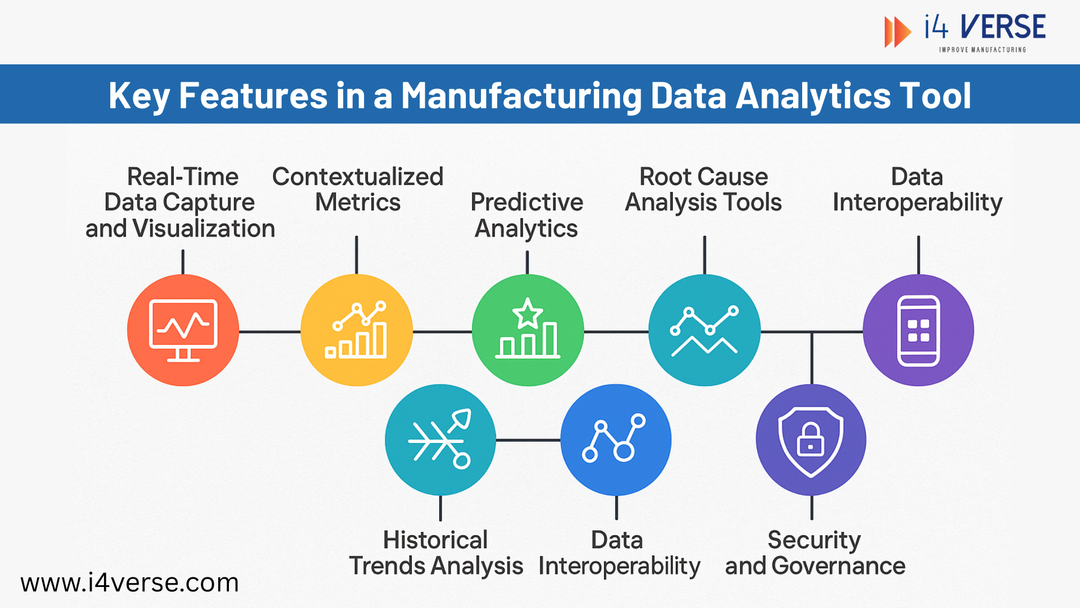
1. Real-Time Data Capture and Visualization
A delay in visibility is a delay in response. In production environments, delays cost time, material, and often—customers. Real-time analytics means the system pulls data continuously from machines, lines, sensors, and operator input systems, then updates dashboards within seconds. This allows supervisors to detect bottlenecks as they form, quality teams to spot yield drops instantly, and maintenance teams to intervene before small issues snowball.
Key capabilities:
- Live streaming of equipment status, performance metrics, and quality indicators
- Auto-refreshing dashboards with drill-down views by station, shift, or product
- Threshold alerts that trigger visual or email notifications for immediate action
- Real-time data also helps in achieving zero defect manufacturing by tracking and managing defects instant as and when they occur.
Real-time analytics is the foundation of agility. When problems are visible the moment they occur, they can be addressed before they escalate.
2. Contextualized Metrics with Root-Cause Visibility
A quality drop isn’t just a number—it’s a symptom. To act effectively, teams need to understand the underlying context.
Contextualized analytics go beyond capturing the “what” to document the “why.” Was there a spike in cycle time due to tool wear? Did a specific operator miss an inspection step? Did quality slip correlate with a change in material batch?
Key capabilities:
- Tagging of downtime reasons, scrap types, and inspection results
- Operator comments and shift notes embedded into metric timelines
- Cross-layer views combining process parameters with human inputs
Without context, teams waste time guessing root causes. With it, they can move quickly from insight to action.
3. Predictive Analytics and Anomaly Detection
By the time you see the problem, it may already be too late. Predictive analytics helps you get ahead of issues—not just react to them.
Anomaly detection uses statistical baselines and machine learning models to identify deviations before thresholds are even breached. For example, if a certain machine usually produces 1% scrap but is trending toward 2%, the system can flag it early—even if the hard limit is 3%. Discover how smart factory solutions helps in reducing scrap rate and lower the manufacturing cost in our latest presentation.
Key capabilities:
- Pattern recognition across shifts, machines, and product variants
- Auto-detection of trends outside statistical norms
- Root cause hints derived from correlations between variables
Predictive tools help teams shift from firefighting to proactive control—catching hidden inefficiencies or risks while they’re still cheap to fix.
4. Custom KPI Builders and Role-Based Dashboards
Different roles care about different metrics—and a good system adapts to them all. Operators need simple, station-level feedback. Supervisors want to compare shifts. Maintenance cares about MTTR. Quality teams focus on defect types. Executives need top-line OEE trends.
Explore how OEE can be improved with MES smart factory solution.
Key capabilities:
- KPI builder to define metrics tailored to your process (e.g., “rework per SKU”)
- Dashboard personalization by role, department, or access level
- Visualizations ranging from detailed timelines to heatmaps and Pareto charts
Analytics should fit the user—not the other way around. When people see what’s relevant to their goals, data becomes a tool, not a burden.
5. Embedded Root Cause Analysis and Problem-Solving Tools
Knowing what went wrong is only half the equation. Fixing it—and preventing recurrence—is the end goal. Integrated problem-solving tools allow teams to launch an RCA or corrective action the moment a metric flags concern. Rather than opening a separate spreadsheet or form, they can explore Pareto charts, 5 Whys, or Ishikawa diagrams within the same environment where the issue was detected.
Key capabilities:
- Built-in templates for RCA, 5 Whys, and containment actions
- Linkage between metrics and historical root causes
- Progress tracking of corrective and preventive actions (CAPAs)
The faster you go from detection to correction, the fewer defects, complaints, and repeated issues you’ll face.
6. Historical Trends and Benchmarking Analytics
Some problems don’t show up in the moment—they emerge over time. Long-term trend analysis is essential for identifying chronic inefficiencies, degradation in equipment, or shifts in operator performance. Benchmarking helps teams see how their line, shift, or site compares to others—laying the foundation for internal best practice sharing.
Key capabilities:
- Multi-period comparison (e.g., “this month vs. last quarter”)
- Performance before/after changes (e.g., new SOP, new supplier)
- Cross-site benchmarking and performance rollups
Improvement isn’t just about what’s broken—it’s about spotting where you could be better.
7. Seamless Data Interoperability and Open APIs
Manufacturing doesn’t run on one system. Your analytics tool must plug into a complex stack—from sensors to ERPs to maintenance apps. Data analytics tools should act as a hub—not a silo. They should consolidate inputs from multiple systems and push insights wherever needed.
Key capabilities:
- Pre-built integrations with PLCs, SCADA, ERP, or quality systems
- Open REST APIs for custom apps and reporting pipelines
- Data export in common formats (CSV, JSON) for audits or modeling
If you can’t trust the data pipeline, you can’t trust the insight.
8. Mobile-First, Operator-Friendly Design
Analytics is not just for the back office. It’s for the people running the line. Modern tools must be accessible at the point of use—on tablets, large screens, or even mobile phones. Whether it’s a quality checker verifying current defect rates or a supervisor reviewing OEE during a Gemba walk, access should be instant.
Key capabilities:
- Responsive design for mobile, tablet, and workstation displays
- QR-code scanning to pull up station- or part-specific analytics
- Localized language support and simple UI for frontline usability
When frontline teams are informed, empowered, and equipped—they deliver results.
9. Security, Compliance, and Governance
Manufacturing data is sensitive. From intellectual property to traceability logs, it needs protection. Your analytics tool should have clear audit trails, robust access control, and compliance-readiness for industries like aerospace, pharma, or automotive.
Key capabilities:
- Role-based permissions and two-factor authentication
- Data encryption at rest and in transit
- Audit logs for changes, views, and data edits
Security isn’t just about preventing leaks—it’s about building trust in the data that drives decisions.
Final Thoughts: Great Analytics Needs a Great Foundation
Real-time performance visibility. Deep root-cause insights. Predictive warnings. Long-term trend recognition. A good analytics system doesn’t just display data—it drives action across roles, shifts, and sites.
But these capabilities don’t emerge from spreadsheets or static dashboards. They require a platform that understands manufacturing complexity and is built to handle real-time performance, context, and operational nuance.
If you’re looking to put these features into action, explore our curated MES Solutions category.